

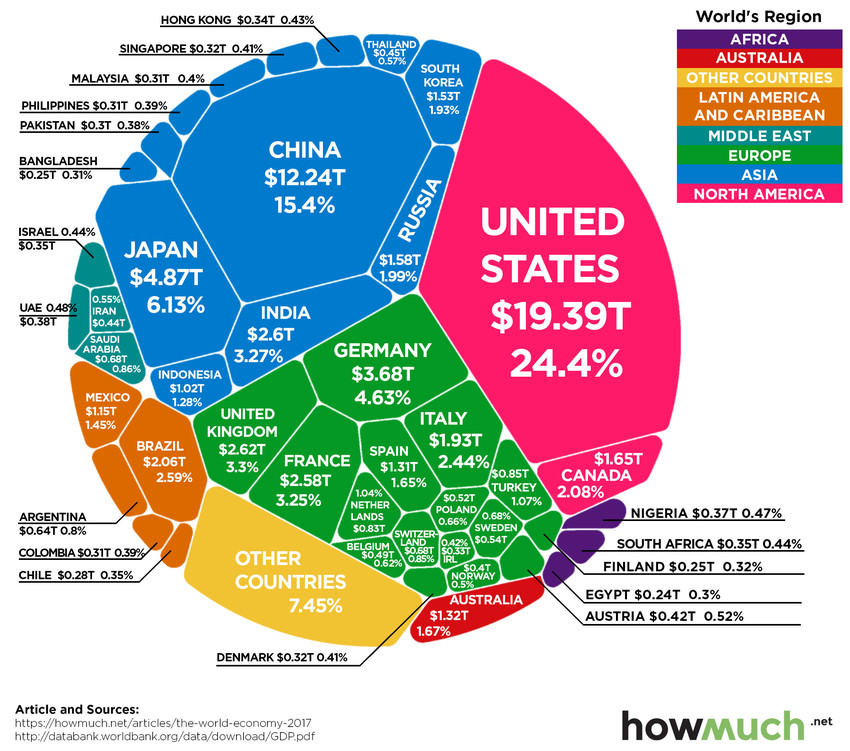
The latest estimate from the World Bank puts global GDP at roughly $80 trillion in nominal terms for 2017.
Today’s chart from HowMuch.net uses this data to show all major economies in a visualization called a Voronoi diagram – let’s dive into the stats to learn more.
The world’s top 10 economies
Here are the world’s top 10 economies, which together combine for a whopping two-thirds of global GDP.
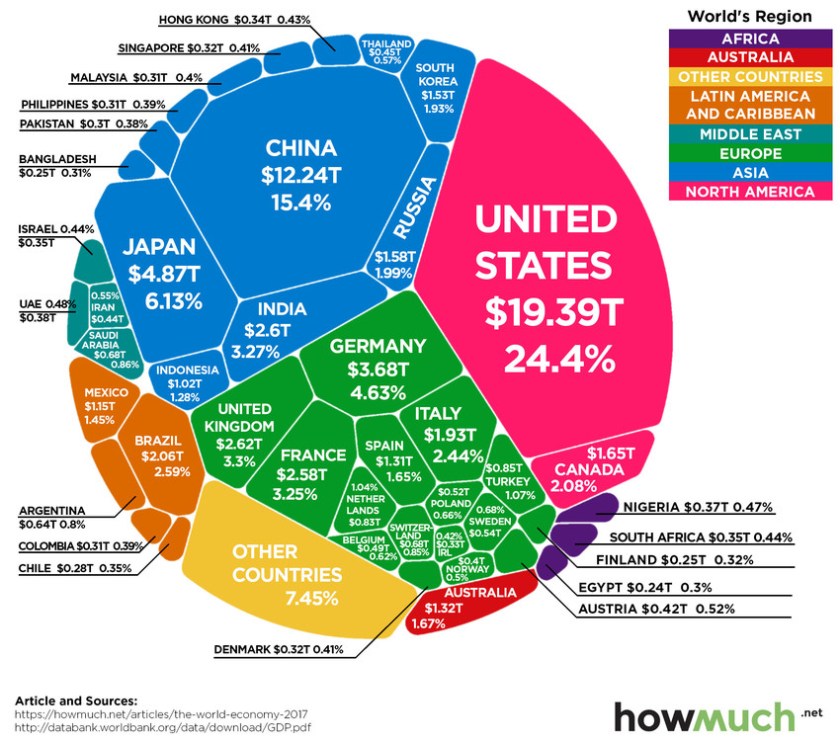
In nominal terms, the US still has the largest GDP at $19.4 trillion, making up 24.4% of the world economy.
While China’s economy is far behind in nominal terms at $12.2 trillion, you may recall that the Chinese economy has been the world’s largest when adjusted for purchasing power parity (PPP) since 2016.
The next two largest economies are Japan ($4.9 trillion) and Germany ($4.6 trillion) – and when added to the U.S. and China, the top four economies combined account for over 50% of the world economy.
Here are some of the most important recent movements:
India has now passed France in nominal terms with a $2.6 trillion economy, which is about 3.3% of the global total. In the most recent quarter, Indian GDP growth saw its highest growth rate in two years at about 8.2%.
Brazil, despite its very recent economic woes, surpassed Italy in GDP rankings to take the #8 spot overall.
Turkey has surpassed The Netherlands to become the world’s 17th largest economy, and Saudi Arabia has jumped past Switzerland to claim the 19th spot.
